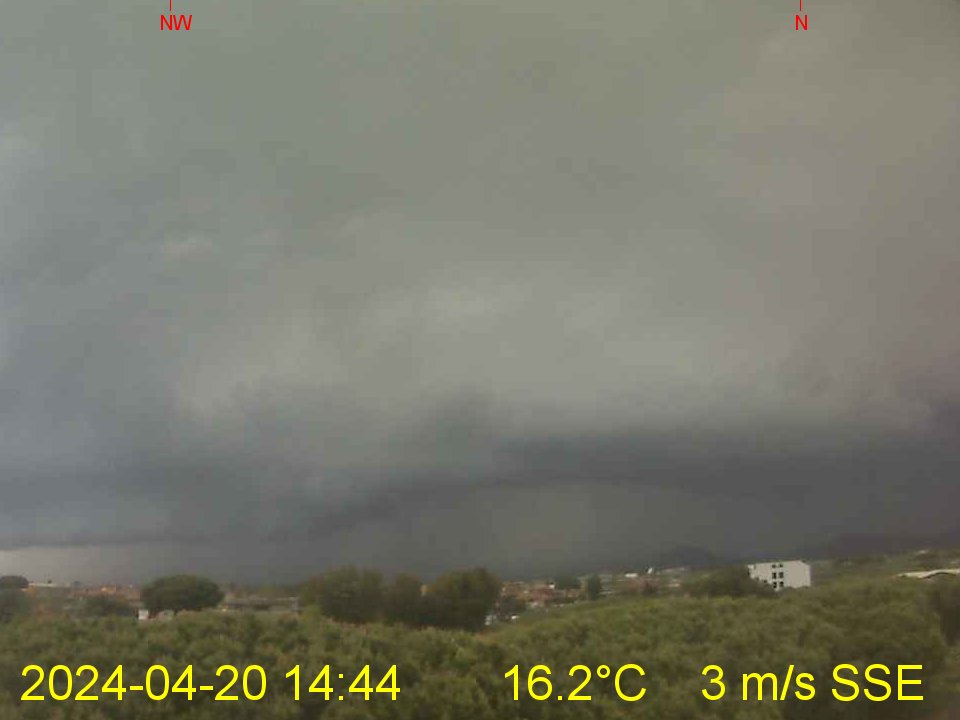
| Weather data Ladispoli (Rome) | |||
|---|---|---|---|
| LAST READING AT TIME: 16:00 DATE: 17 June 2026 ,Time of next update: 16:15:00 | |||
| Current Weather | Humid | Current Temperature | 25.8 °C (78.4°F) (Heat Index 27.7 °C ), Apparent temp 29.4 °C |
| Maximum Temperature (since 0 hour ) | 26.8 °C at: 14:54 | Minimum Temperature (since 0 hour ) | 18.8 °C at: 06:05 |
| Average windspeed (ten minute) | 3.1 m/s | Wind Direction (ten minute) | WSW (246ş) |
| Heat Index | 27.7 °C | Maximum Gust (last hour) | 7.2 m/s at: 15:52 |
| Maximum Gust (since 0 hour ) | 7.2 m/s at: 13:50 | Maximum 1 minute average (since 0 hour ) | 5.1 m/s at: 13:18 |
| Rainfall (last hour) | 0.0 mm | Rainfall (since 0 hour ) | 0.0 mm (0.000 in.) |
| Rainfall This month | 0.2 mm (0.008 in.) | Rainfall To date this year | 367.8 mm (14.480 in.) |
| Maximum rain per minute (last hour) | 0.0 mm/min | Maximum rain per hour (last 6 hours) | 0.0 mm/hour |
| Yesterdays rainfall | 0.0 mm | DewPoint | 25.8 °C (Wet Bulb :25.8 °C ) |
| Humidity | 100 %, Humidex 39.0 °C | Barometer corrected to msl | 1028.1 mb |
| Pressure change | -0.3 mb (last hour) | Trend | FALLING |
| Pressure change (last 12 hours) | +0.7 mb | Pressure change (last 6 hours) | -0.7 mb |

Service Removed This Service is no longer available
In Accordance with NWS Service Change Notice 16-16 this service has been discontinued. Please see Weather.gov and tgftp.nws.noaa.gov (raw data)Service Removed This Service is no longer available
In Accordance with NWS Service Change Notice 16-16 this service has been discontinued. Please see Weather.gov and tgftp.nws.noaa.gov (raw data)Service Removed This Service is no longer available
In Accordance with NWS Service Change Notice 16-16 this service has been discontinued. Please see Weather.gov and tgftp.nws.noaa.gov (raw data)
Use the RELOAD facility on your browser to retrieve the latest data.